Visualizing Internal Crate Dependencies with dep_graph_rs!
Navigating the tangled web of a massive Rust crate can feel like exploring a dark maze without a guide.
Sure rust-analyzer gives you some hints, but what if you want a bird’s-eye view of how everything connects?
dep_graph_rs comes to the rescue!
It’s a command-line tool that generates a dependency graph for the internal dependencies of your Rust crate.
Vivid dependency graphs at your fingertips!
How does it work?
It parses source code using the syn crate,
analyzes all the use crate statements, tries to find & parse the files they belong to, and builds a directed graph of
how everything is connected.
The output is in a DOT graph, ready for visualization. For now at least, maybe later some more CLI friendly output?
A Real-World Example
I was looking at the
tantivy crate and thinking about extracting the directory
module into its own, separate crate. Before doing that, I wanted a map of its dependencies.
Like a treasure map, but for code!
We can generate a graph of just the dependencies going outwards from the directory module:
dep_graph_rs path/to/tantivy --source "directory.*" > tantivy_directory_deps.dot
And voilà! This command produces a .dot file that can be rendered into this fantastically beautiful graph:
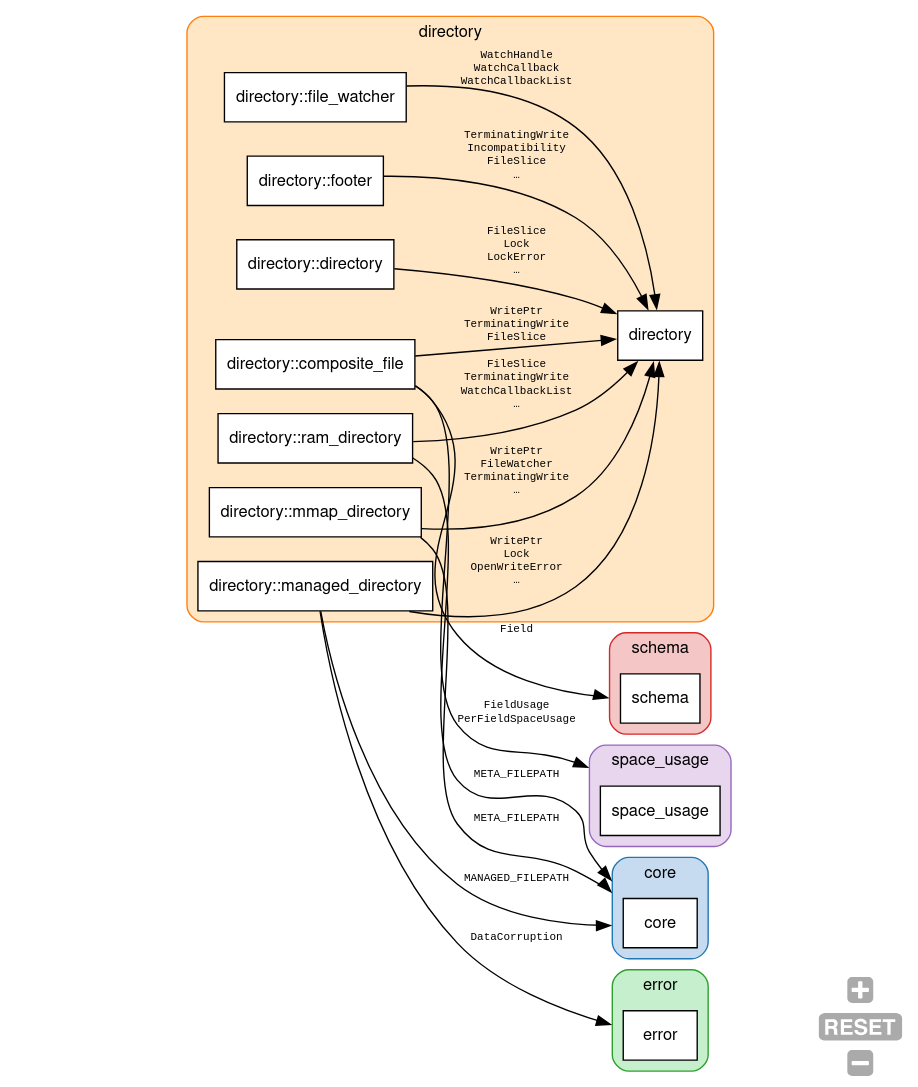
Yes, this graph indeed has colors! We really live in the future.
There are two constants, META_FILEPATH and MANAGED_FILEPATH in core, that maybe could be moved into the directory module?
To find out, we can create a new graph that only shows these two items:
dep_graph_rs path/to/tantivy/ --item "META_FILEPATH|MANAGED_FILEPATH" | xclip -selection clipboard
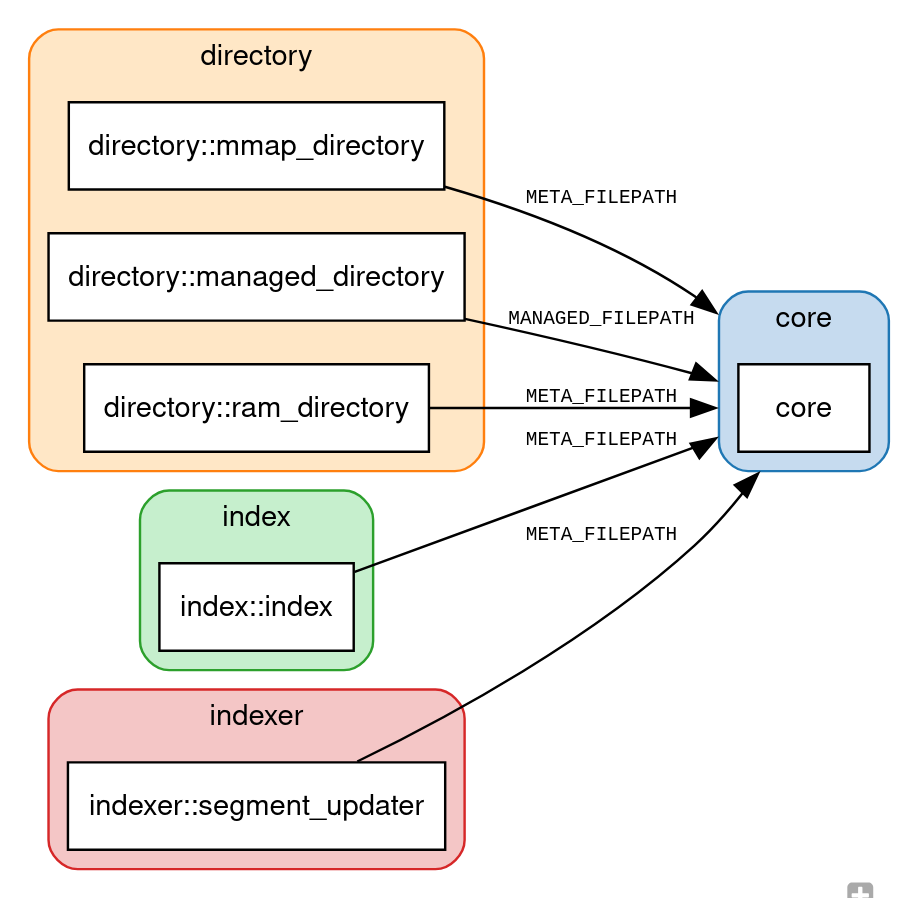
Now we can see that these two constants have some unexpected dependencies,
which might complicate the extraction of the directory module into its own crate.
Features
- Generates dependency graphs from your Rust source code.
- Outputs in DOT format, so you can use it with awesome tools like Graphviz.
- Group dependencies by file or by module.
- Filter the graph by source, destination, or even the specific item being imported (like a function or struct).
- Clusters nodes by their root module for a cleaner, more readable graph.
How to Use It
First, install it with cargo:
cargo install dep_graph_rs
Then, just run it from your crate’s root directory:
dep_graph_rs > graph.dot
This will output the dependency graph in DOT format into a file named graph.dot.
To render the graph, you have a couple of options:
- Online: The quickest way is to copy the contents of
graph.dotand paste them into an online viewer like GraphvizOnline. - Local: If you have Graphviz installed, you can render it to an image yourself:
dot -Tpng graph.dot -o graph.png
Powerful Filtering
You can slice and dice the graph to only show what you care about.
--mode <MODE>: Group byfileormodule(the default).--source <SOURCE>: Only show dependencies from a specific module.--destination <DESTINATION>: Only show dependencies pointing to a specific module.--item <ITEM>: Filter by the name of the imported item (e.g., a function or struct).
source, destination, and item filters are exact matches, except if they contain regex characters, in which case they are treated as regex patterns.
Limitations & Disclaimer
This tool is still in its early stages, so expect some rough edges.
Glob dependencies (*) are not correctly handled yet, so if you have use crate::mega_module::*;, it will not resolve the actual items being used here.
Exceedingly large unfiltered graphs can be overwhelming for your brain and your computer.